Catherine Mullen, PhD

PhD Candidate, Department of Foklore and Ethnomusicology, Indiana University
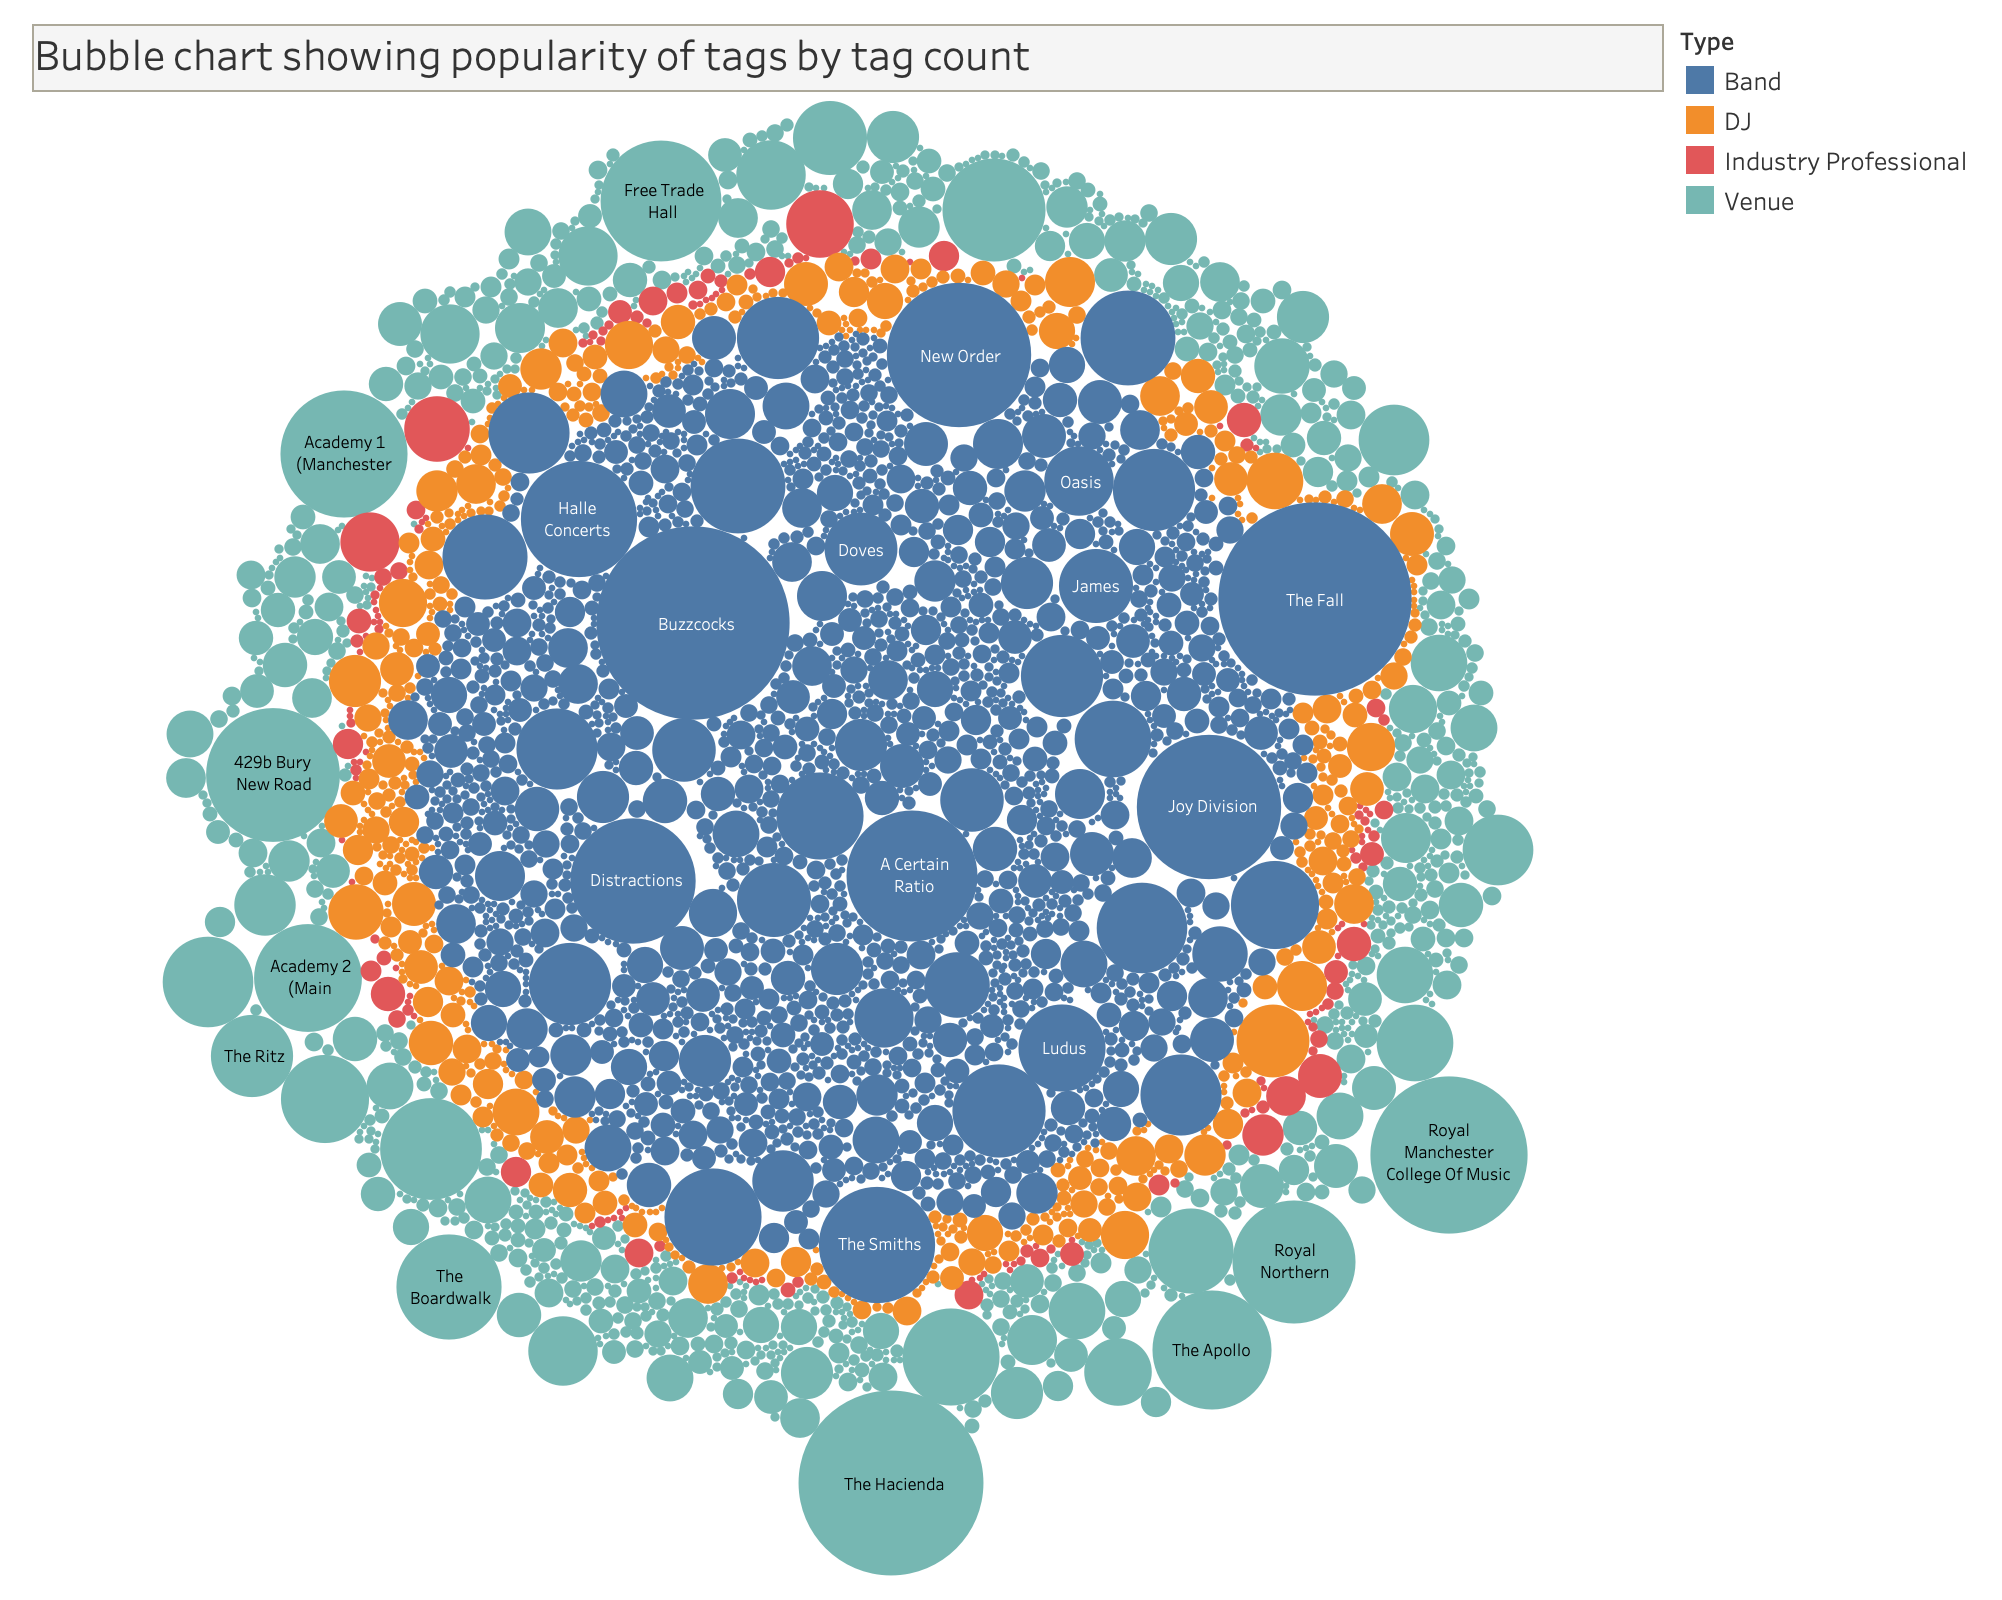
Figure 3: Bubble Chart of Tag Popularity
Archival use and growth are represented not only by the number of artifacts contributed, by also in the accumulation of different types of tags. The four tags available to users at the time of data collection were bands, DJs, venues, and industry professionals. Below is a bubble chart that shows overall quantities of tags in the archive by type, distinguishing some of the most prominent tags with labels.
The following video walkthrough further demonstrates what data informs the bubble chart and talks about how this information contributes to an understanding of MDMA’s content.